Getting started
Reading and manipulating spectra
First let’s download an example spectrum:
from astropy.utils.data import download_file

base_url = "https://drive.google.com/uc?export=download&id={0}"
lkca4_id = "1x3nIg1P5tYFQqJrwEpQU11XQOs3ImH3v"
lkca4_url = base_url.format(lkca4_id)

spectrum_path = download_file(lkca4_url)
Now let’s read the spectrum into an EchelleSpectrum object:
from chia import EchelleSpectrum
spectrum = EchelleSpectrum.from_e2ds(spectrum_path)
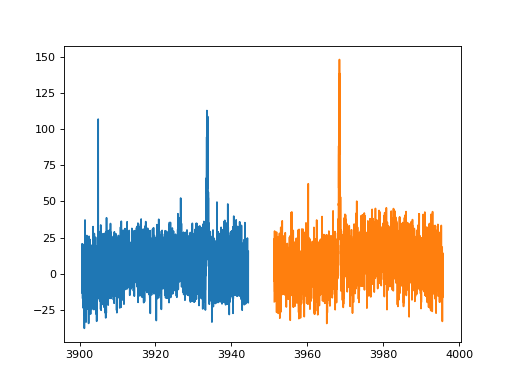
The new EchelleSpectrum object has an order attribute that allows
us to access each order of the echelle spectrum through accessing a list, like
so:
import matplotlib.pyplot as plt

for i in [5, 7]:
    spectrum.orders[i].plot()

plt.show()
(Source code, png, hires.png, pdf)
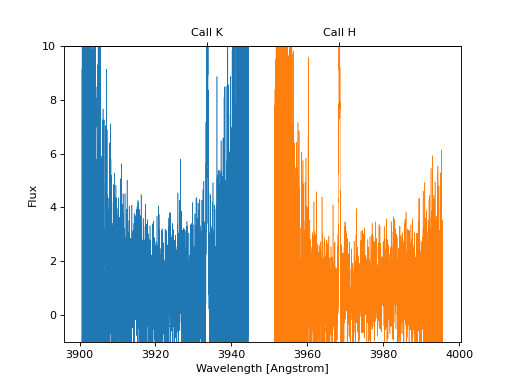
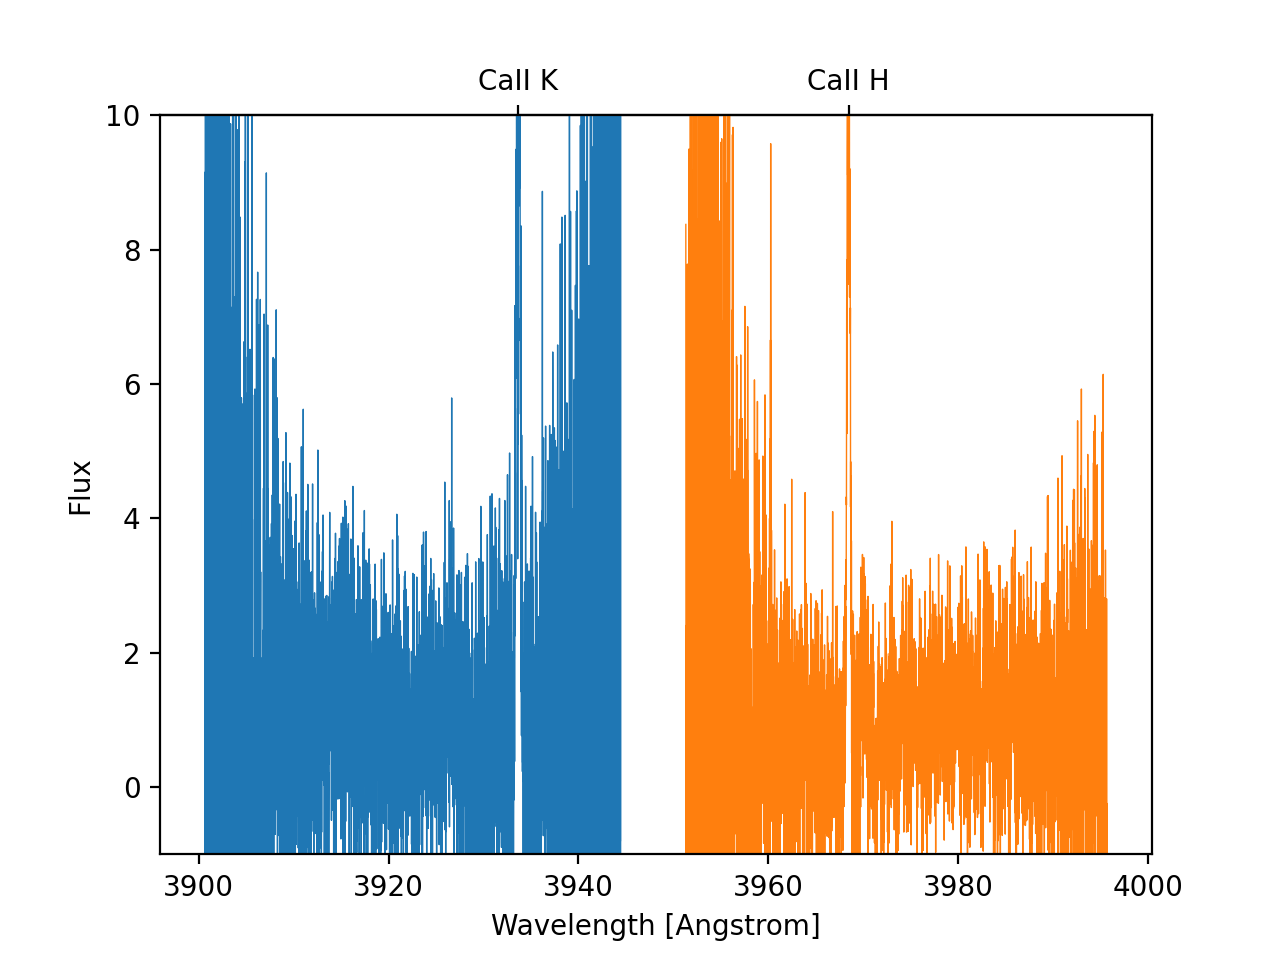
We can continuum normalize each order of the echelle spectrum like so:
spectrum.continuum_normalize()

for i in [5, 7]:
    spectrum.orders[i].plot(lw=0.5)

ax = plt.gca()
secax = ax.secondary_xaxis('top', functions=(lambda x: x, lambda x: x))
secax.set_xticks([3968.47, 3933.66])
secax.set_xticklabels(['CaII H', 'CaII K'])
plt.xlabel('Wavelength [Angstrom]')
plt.ylabel('Flux')
plt.ylim([-1, 10])
plt.show()
(Source code, png, hires.png, pdf)